Validation
Overview
Our sensor technology has been tested extensively — across multiple years, multiple applications, and by independent third parties with no stake in the outcome.
- Multi-year internal development program — spanning hydrogen detection, food spoilage, gas mapping, and wireless deployment across a range of real-world conditions.
- Independent testing at Steinbeis, University of Tübingen — one of the world's leading gas sensor research laboratories. Sensitivity confirmed across 12 gases at concentrations from sub-ppm to thousands of ppm, unheated.
- Four-year technology evaluation by a leading global sensor manufacturer — temperature cycling, humidity, drift, and hydrogen response tested across multiple prototype generations. Ultra-low power identified as a key differentiator.
- Application testing at one of the world's leading fuel cell manufacturers — sensor performance validated in operating fuel cell conditions.
Selected validation data is presented below.
NSI data
H₂ concentration response
Wireless measurements using low-cost, ultra-low power electronics. Three prototype NSI sensors exposed to hydrogen concentrations from 500 ppm to 30,000 ppm (3%). All three show consistent, repeatable response across the full range — well below the 4% lower explosive limit. Fast response and full reversibility confirmed on gas removal.
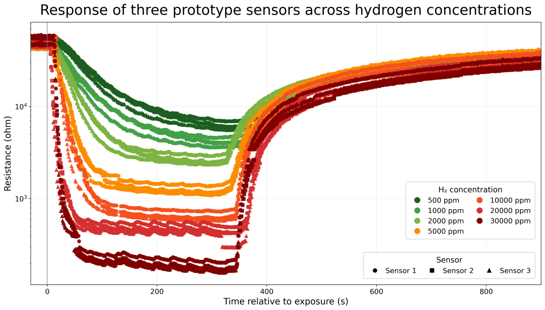
Fig. 1 — H₂ concentration response. Three NSI sensors show near-identical resistance response across 500 ppm to 30,000 ppm H₂. Sensor unheated throughout. Full reversibility on gas removal confirmed.
Part-to-part consistency
15 sensors exposed simultaneously to 2% hydrogen in air. The part-to-part variation is small relative to the signal, making individual calibration unnecessary for indicative type measurements.
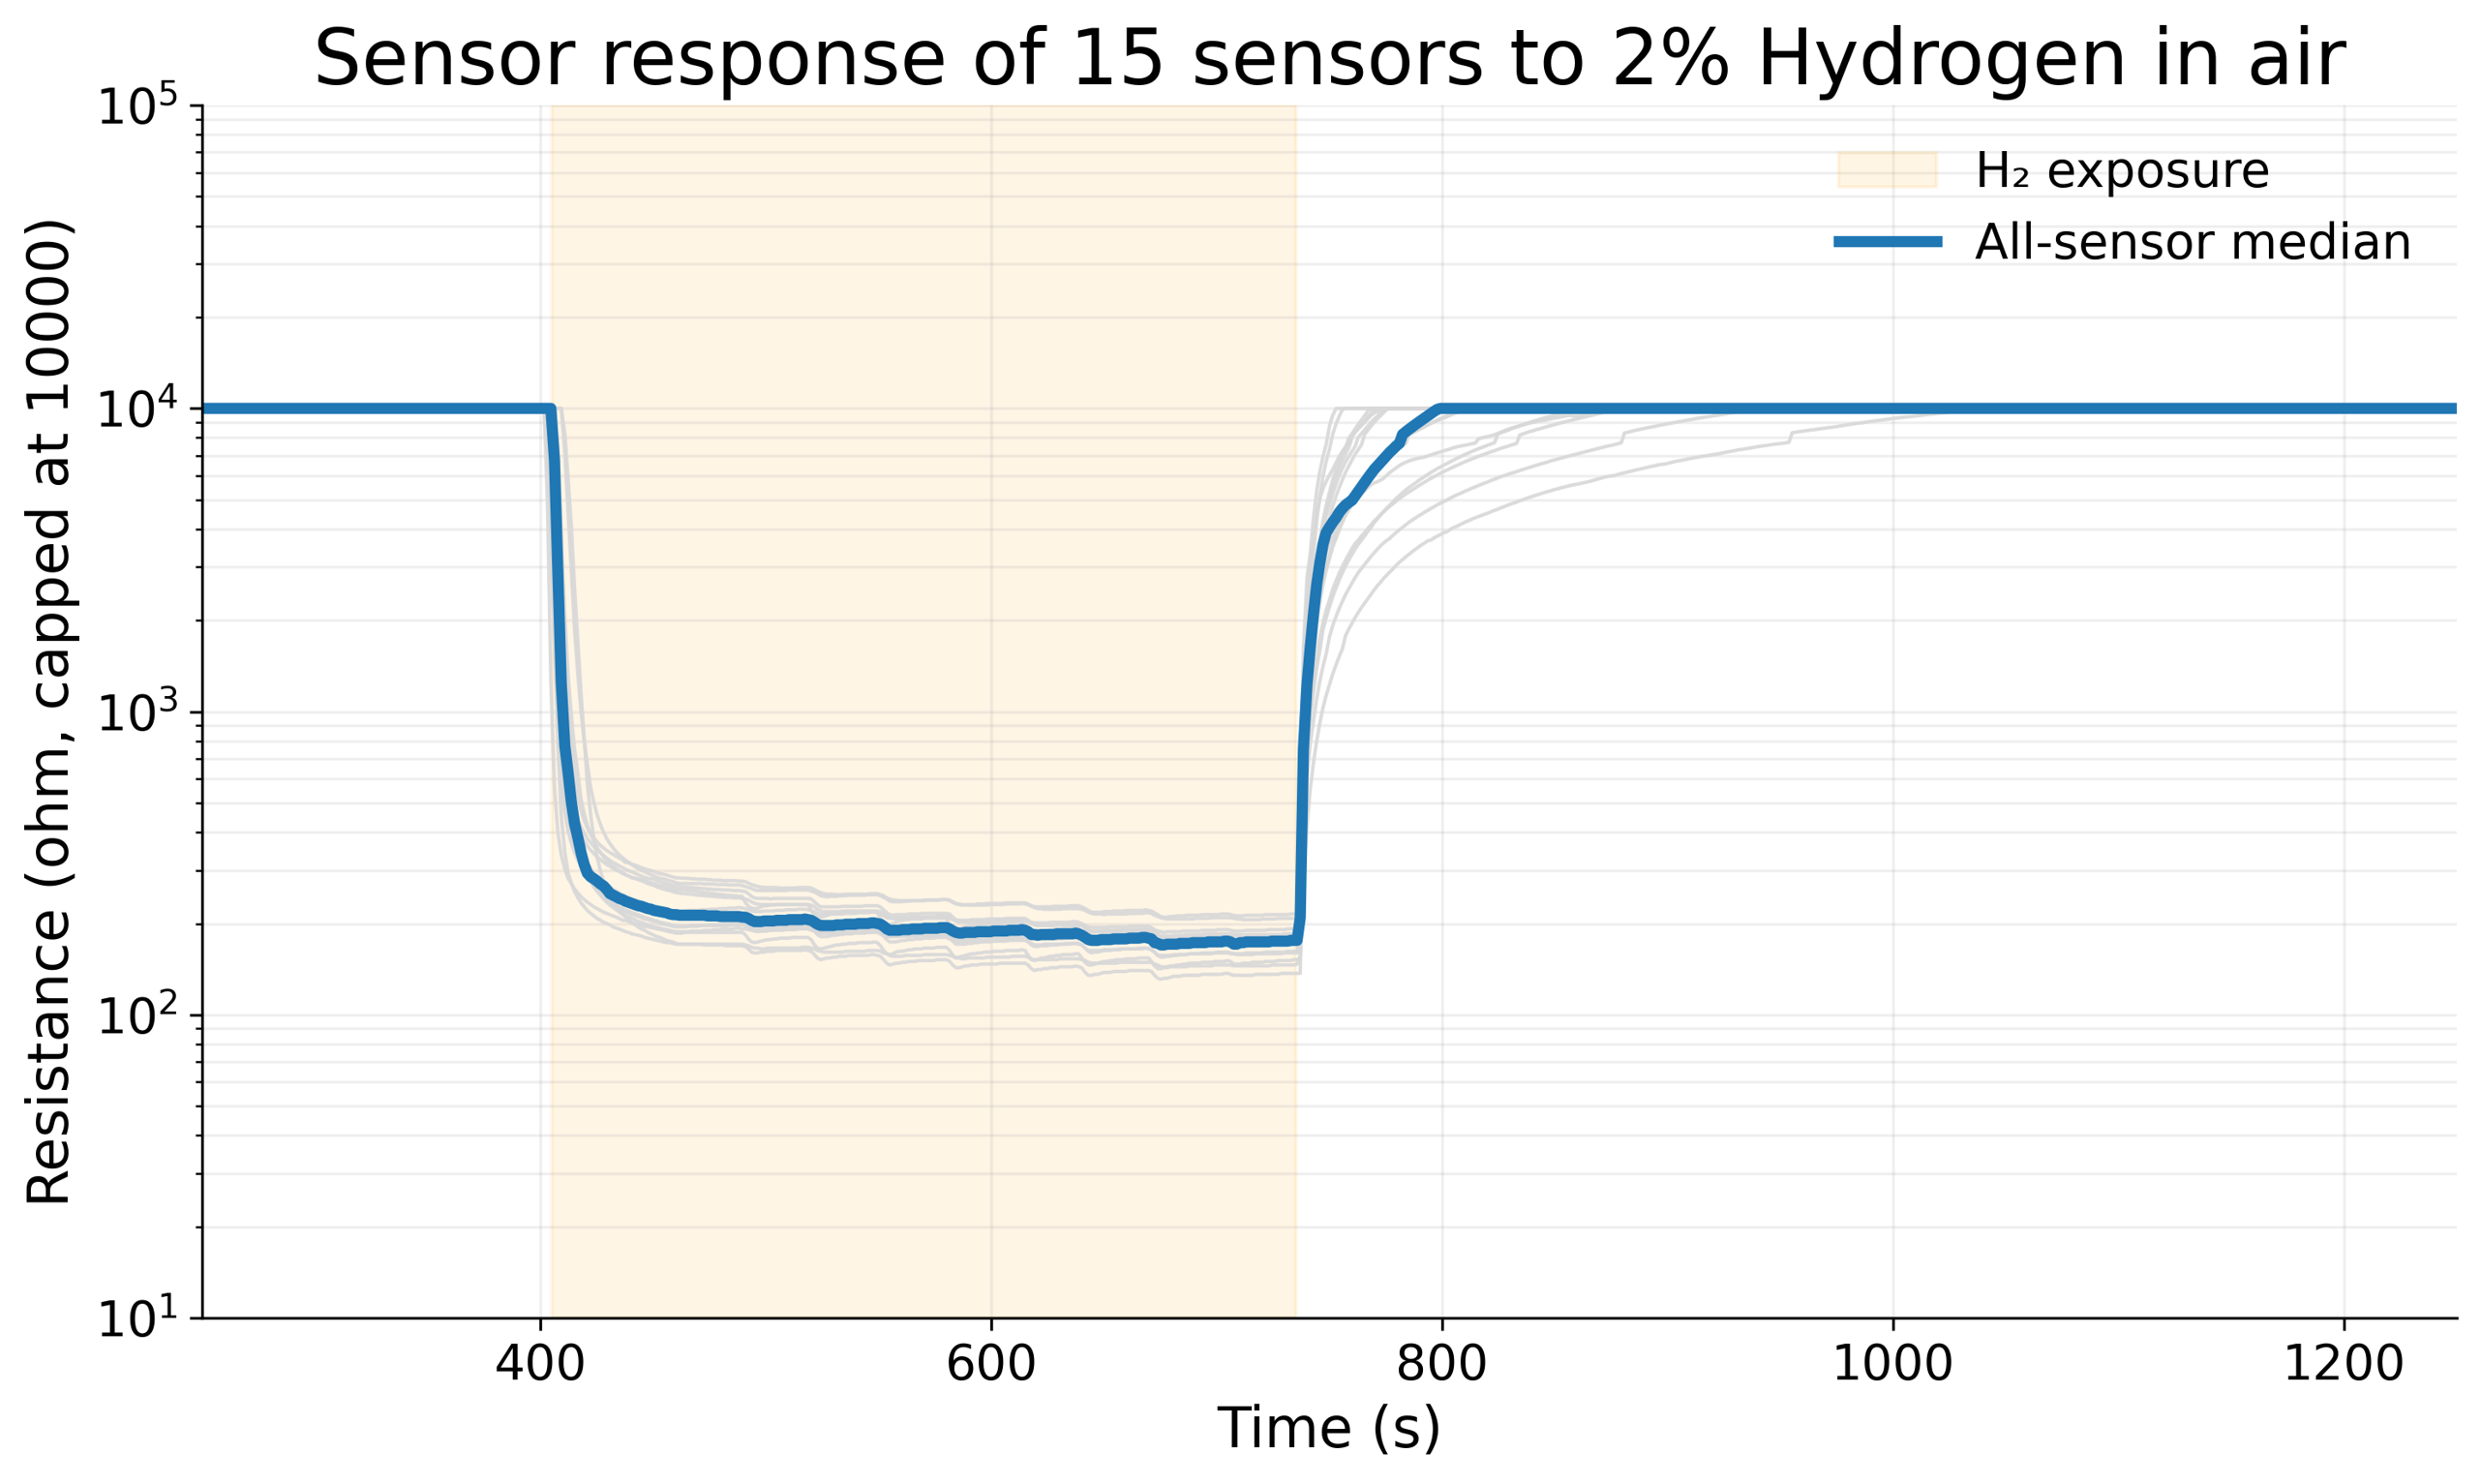
Fig. 2 — Part-to-part consistency. 15 sensors (grey traces) with all-sensor median (blue). Tight response band across all units at 2% H₂ exposure.
Independent university testing
Sensitivity to other gases — measured at Steinbeis, University of Tübingen
Independent testing confirmed strong sensor response to a wide range of reducing gases — including H₂, CO, ethanol, acetone, and H₂S — at concentrations from sub-ppm to thousands of ppm. The sensor was unheated throughout. Oxidizing gases (NO₂, O₃) showed inverse response as expected.
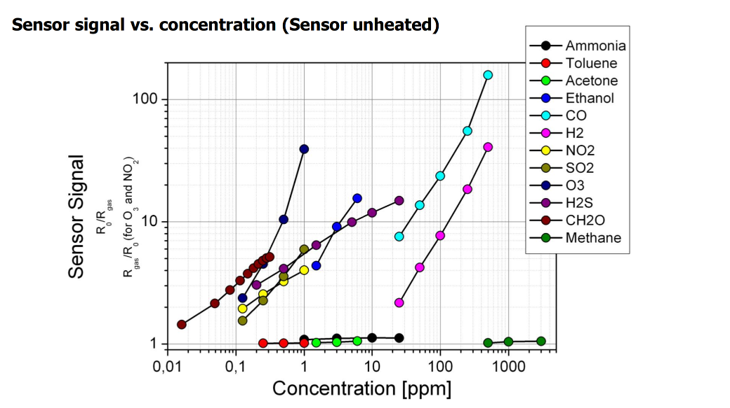
Fig. 3 — Multi-gas response (Steinbeis, University of Tübingen). Sensor signal vs. concentration for 12 gases. Strong response to reducing gases including H₂, CO, ethanol, acetone, and H₂S. Sensor unheated throughout. Log-log scale.
Industry evaluation
Four-year evaluation by a major sensor manufacturer
A major global sensor manufacturer conducted an independent evaluation of multiple prototype generations over four years. Testing included:
- Temperature cycling — −15°C to 60°C
- Humidity — 0% to 90% RH
- Sensor drift evaluation over time
- Focus on hydrogen, other gases explored
Evaluation data consistent with indicative sensor capabilities. Ultra-low power capability identified as an attractive feature.
Years of sensor test data available to assess against your application requirements.